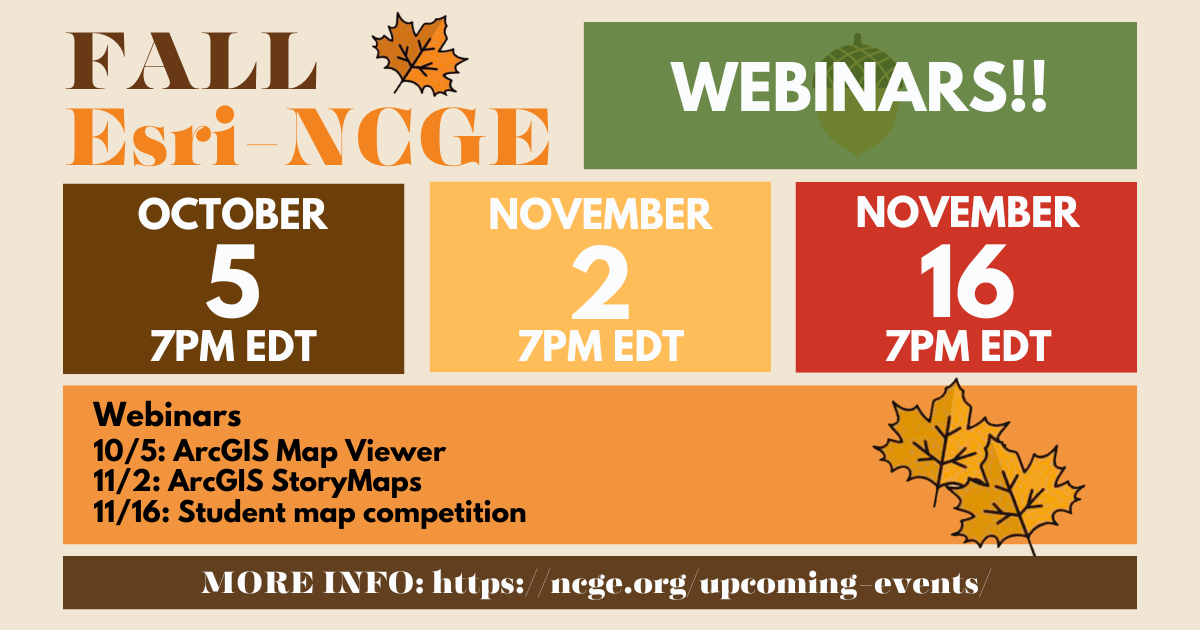

Are you creating storymaps? Engaging students in the Esri-NCGE student storymap competition? Then this webinar is for you! Part of a 3-part series by Esri designed to support educators who are looking to engage their students in the world of geography. In this webinar, Tom Baker and Charlie Fitzpatrick will discuss the map viewer as the cornerstone for visualizing map-based data. In this webinar, we will cover the basics of creating maps using data from ArcGIS Online or collected by students.
Tom Baker is an education manager on the Esri Education Solutions team, strategizing effective use of GIS technology and solutions to solve instruction, administrative, and research challenges in schools, universities, and informal education. An instructional technologist and researcher by training, he now specializes in integrating classroom practice and technology with GIS. Most of Tom’s time at Esri is spent serving the nearly 5 million K12 educators of the United States—and their 50 million students. Tom seeks to use his experience to enhance learning at all levels and subjects by leveraging the science of where.
Charlie Fitzpatrick is K12 Education manager at Esri. After being a formal student for many years, he taught social studies in grades 7-12 (mostly 8th grade geography) for 15 years. He also started teaching teachers to understand the patterns, relationships, and systems of the world using computers. He joined Esri as education manager in 1992, where he works with students, educators, and influencers across the nation. He and his colleagues work to provide software, instructional resources, and educator support free to every school and club, so learners of all ages can explore and understand the world, analyze information, make good decisions, and solve problems by thinking geographically using GIS.
Webinar Access
#open access | Join Here